IRI – International Research Institute for Climate and Society | August 2022 Quick Look
You can highlight a specific model by hovering over it either on the chart or the legend. Selecting An item on the legend will toggle the visibility of the model on the page. You can also select DYN MODELS or STAT MODELS to toggle them all at once. Clicking on the “burger” menu above the legend will give you options to download the image or expand to full screen. If you have any feedback on this new feature, please let us know at [email protected] .
The following graph and table show forecasts made by dynamical and statistical models for SST in the Nino 3.4 region for nine overlapping 3-month periods. Note that the expected skills of the models, based on historical performance, are not equal to one another. The skills also generally decrease as the lead time increases. Thirdly, forecasts made at some times of the year generally have higher skill than forecasts made at other times of the year–namely, they are better when made between June and December than when they are made between February and May. Differences among the forecasts of the models reflect both differences in model design, and actual uncertainty in the forecast of the possible future SST scenario.
Forecast SST Anomalies (deg C) in the Nino 3.4 Region
Seasons (2022 – 2023)
Model
ASO
SON
OND
NDJ
DJF
JFM
FMA
MAM
AMJ
Dynamical Models
AUS-ACCESS
-0.69
-0.70
-0.67
-0.57
BCC_CSM11m
-0.59
-0.28
0.10
0.51
0.89
1.16
1.31
1.47
1.68
CMC CANSIP
-0.64
-0.80
-0.96
-1.03
-0.94
-0.76
-0.50
-0.29
-0.09
COLA CCSM4
-0.82
-1.03
-1.25
-1.26
-1.02
-0.68
-0.30
-0.03
0.15
CS-IRI-MM
-0.77
-0.77
-0.76
-0.67
-0.46
-0.26
ECMWF
-0.65
-0.54
-0.46
-0.39
-0.32
GFDL SPEAR
-0.57
-0.54
-0.54
-0.42
-0.18
0.09
0.30
0.48
0.61
IOCAS ICM
-0.94
-1.11
-1.41
-1.68
-1.85
-1.89
-1.78
-1.60
-1.48
JMA
-0.77
-0.76
-0.75
-0.66
-0.43
KMA
-0.80
-1.00
-0.90
-0.80
-0.50
LDEO
-0.17
-0.10
-0.04
-0.01
0.01
-0.02
-0.08
-0.16
-0.23
MetFRANCE
-0.85
-0.80
-0.84
-0.90
-0.85
-0.58
-0.42
NASA GMAO
-1.38
-1.83
-1.92
-1.66
-1.18
-0.65
-0.21
NCEP CFSv2
-1.02
-1.05
-0.99
-0.79
-0.48
-0.21
0.04
SAUDI-KAU
-0.75
-0.64
-0.44
-0.20
0.04
0.19
0.27
0.29
0.26
SINTEX-F
-0.34
-0.30
-0.19
-0.03
0.18
0.37
0.57
0.72
0.85
UKMO
-1.32
-1.46
-1.42
-1.24
Average, Dynamical models
-0.768
-0.807
-0.791
-0.693
-0.472
-0.269
-0.073
0.109
0.219
Statistical Models
BCC_RZDM
-1.44
-1.71
-1.94
-2.04
-1.89
-1.57
-1.05
-0.46
0.15
CPC CA
-1.06
-1.21
-1.30
-1.25
-0.95
-0.59
-0.20
0.14
0.49
CPC MRKOV
-0.90
-0.82
-0.69
-0.49
-0.28
-0.09
0.02
0.14
0.25
CSU CLIPR
-0.66
-0.69
-0.72
-0.75
-0.62
-0.49
-0.36
-0.18
-0.01
IAP-NN
-0.69
-0.60
-0.45
-0.29
-0.12
0.04
0.19
0.30
0.37
NTU CODA
-0.58
-0.67
-0.86
-0.95
-0.94
-0.76
-0.56
-0.46
-0.45
UCLA-TCD
-1.03
-1.19
-1.29
-1.26
-1.07
-0.78
-0.43
-0.10
0.17
Average, Statistical models
-0.909
-0.984
-1.036
-1.005
-0.839
-0.605
-0.341
-0.089
0.140
Average, All models
-0.809
-0.858
-0.862
-0.784
-0.589
-0.393
-0.177
0.017
0.182
Discussion of Current Forecasts
For next four seasons (Sep-Nov, Oct-Dec, Nov-Jan, and Dec-Feb), most statistical and several dynamical models indicate a continuation of the current La Niña event. Overall, there is a moderate chance for La Niña to persist during boreal fall and winter before decreasing to 42% in Jan-Mar 2023, and returning to ENSO-neutral thereafter. The probabilities for El Niño conditions remain below very low during the forecast period. Based on the multi-model mean prediction, and the expected skill of the models by start time and lead time, the probabilities (X100) for La Niña, ENSO-neutral and El Niño conditions (using -0.5 °C and 0.5 °C thresholds) over the coming 9 seasons are:
Season
La Niña
Neutral
El Niño
ASO
79
21
0
SON
77
23
0
OND
73
26
1
NDJ
67
31
2
DJF
56
40
4
JFM
42
52
6
FMA
26
65
9
MAM
13
73
14
AMJ
7
68
25
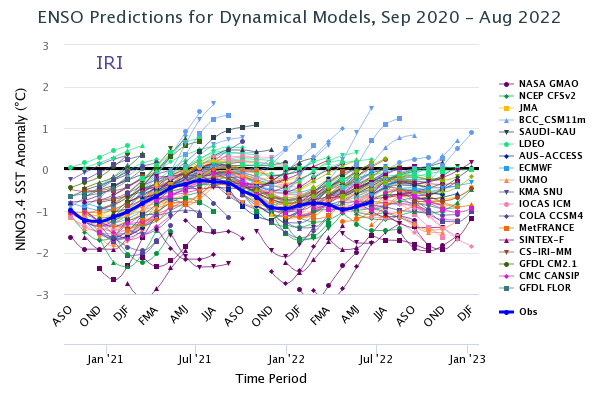
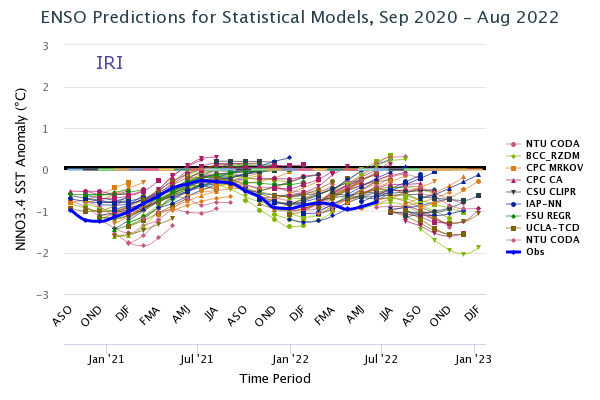
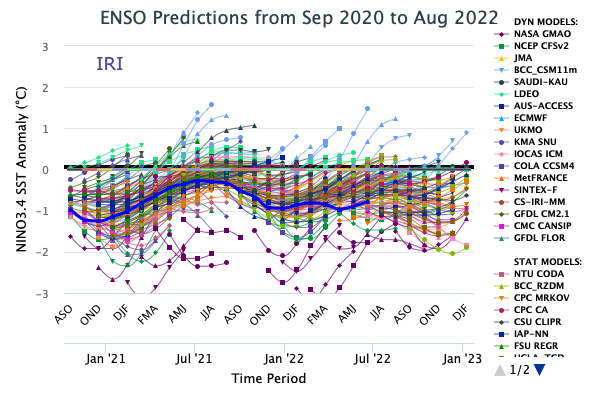
Summary of forecasts issued over last 22 months
The following plots show the model forecasts issued not only from the current month (as in the plot above),
but also from the 21 months previous to this month. The observations are also shown up to the most recently completed
3-month period. The plots allow comparison of plumes from the previous start times, or examination of the forecast
behavior of a given model over time. The first plot shows forecasts for dynamical models, the second for statistical
models, and the third for all models. For less difficult readability, forecasts are shown to a maximum of only the first
five lead times. Below the third plot, we provide a mechanism for highlighting the forecasts of one model at a time against
a background of more lightly colored lines for all other models.
Notes on the data
Only models producing forecasts on a monthly basis are included. This means that some models whose forecasts appear in the Experimental Long-Lead Forecast Bulletin (produced by COLA) do not appear in the table.
The SST anomaly forecasts are for the 3-month periods shown, and are for the Nino 3.4 region (120-170W, 5N-5S). Often, the anomalies are provided directly in a graph or a table by the respective forecasting centers for the Nino 3.4 region. In some cases, however, they are given for 1-month periods, for 3-month periods that skip some of the periods in the above table, and/or only for a region (or regions) other than Nino 3.4. In these cases, the following means are used to obtain the needed anomalies for the table:
- Temporal averaging
- Linear temporal interpolation
- Visual averaging of values on a contoured map
The anomalies shown are those with respect to the base period used to define the normals, which vary among the groups producing model forecasts. They have not been adjusted to anomalies with respect to a common base period. Discrepancies among the climatological SST resulting from differing base periods may be as high as a quarter of a degree C in the worst cases. Forecasters are encouraged to use the standard 1971-2000 period as the base period, or a period not very different from it.